
Challenge
A US wound-care practice works across multiple facilities and professional corporations. Billing data comes from its EHR and billing system, Clinix, as well as the Tebra API. The finance team needed a reporting view that connects imported records with facility economics, fee schedules, provider and nurse pay rules, payroll periods and reconciliation issues.
The work requires different kinds of mapping before the information can be reviewed together. Facility, provider, procedure and CPT, insurance and payer, and adjustment values all need a place in the reporting model. The team also needed facility-level gross profit, CMS fee schedule rates, biweekly reconciliation and forecasts. This is a financial reporting dashboard, not a payroll system.
What we built
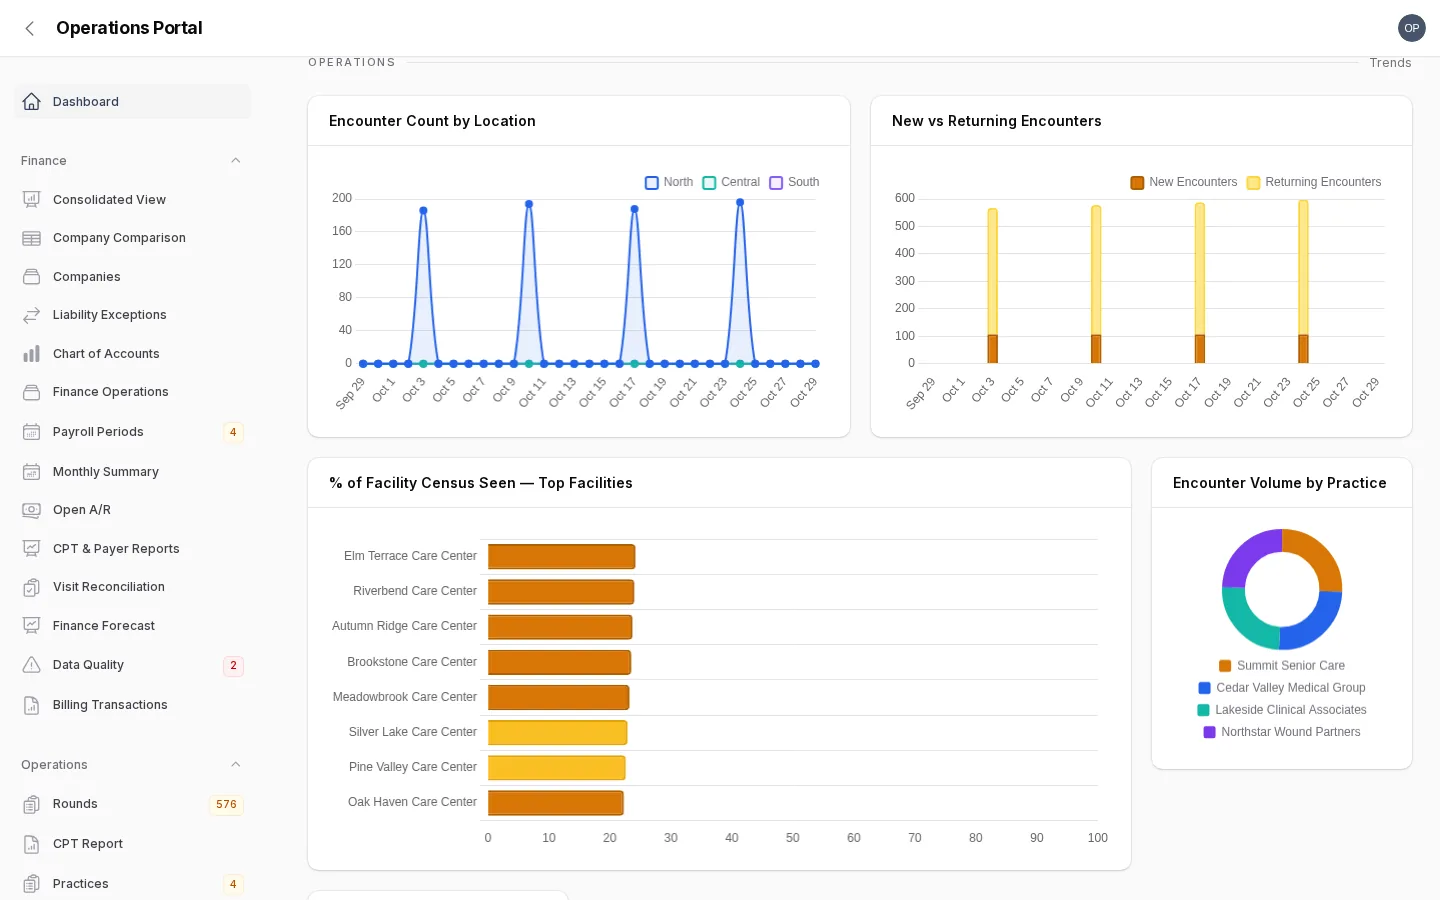
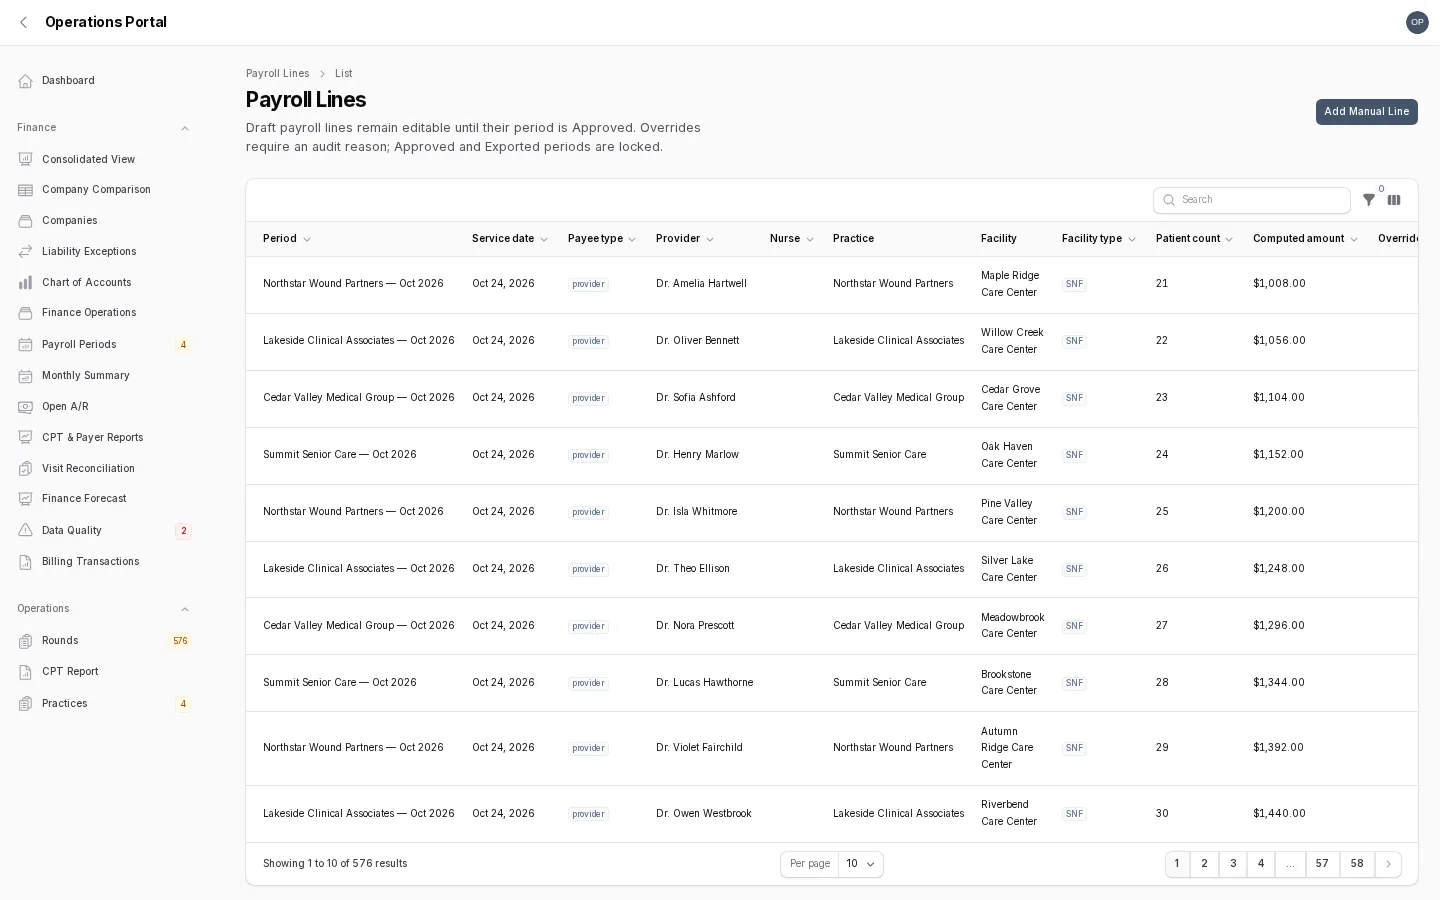
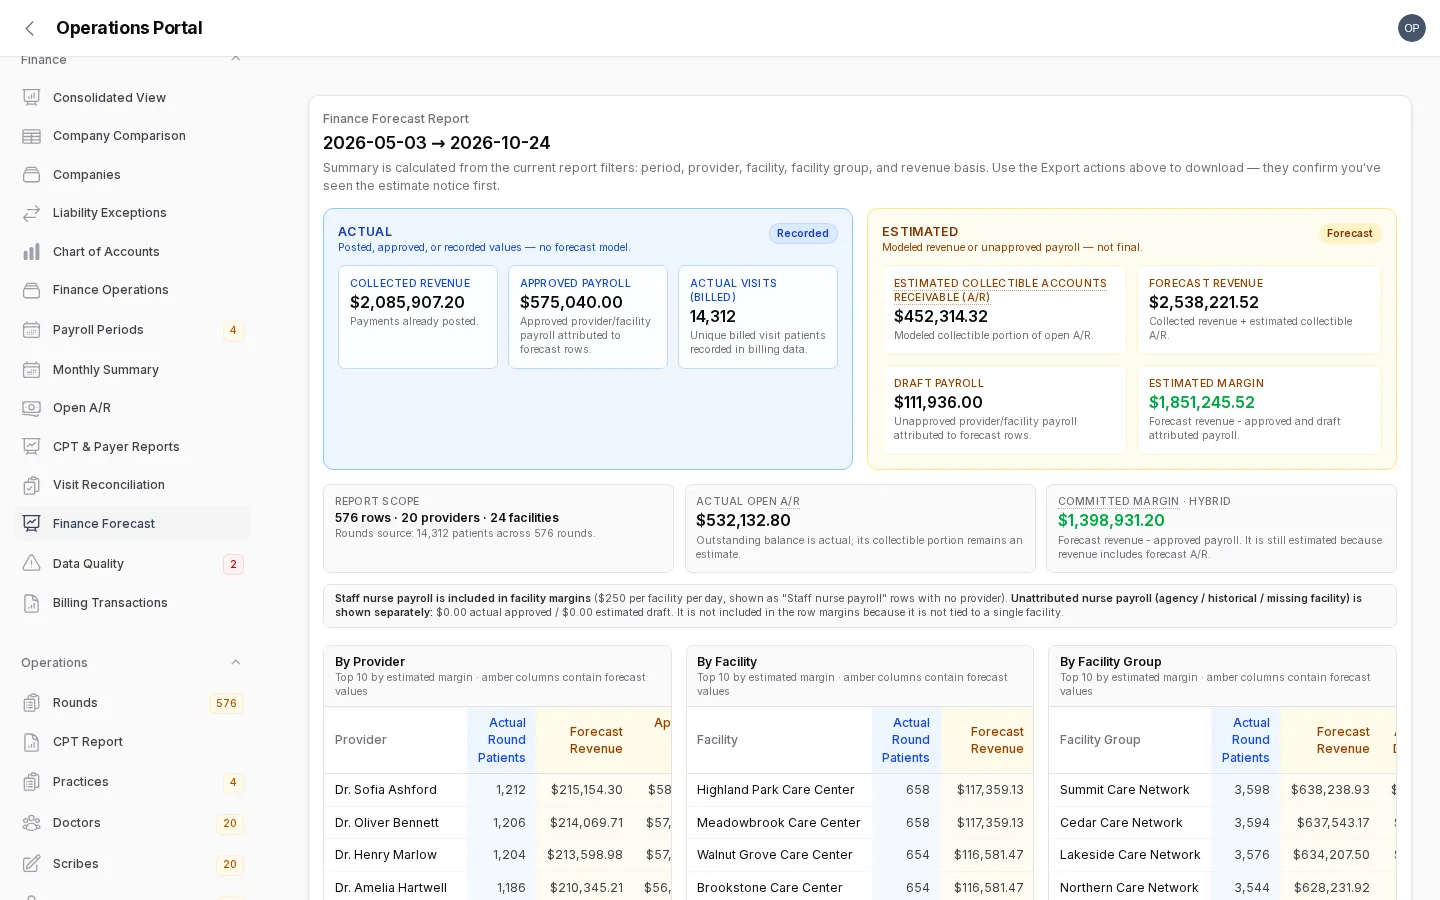
We built a dashboard that imports billing data and organizes it through mapping tables for facilities, providers, procedures and CPT codes, payers and adjustments. Billing rollups present summarized activity, while facility gross profit and CMS fee schedule rates support financial review. Provider and nurse pay rules include facility-per-day calculations so the practice can examine them during biweekly payroll reconciliation.
The platform connects to the Tebra API and accesses Excel through Microsoft Graph. It can export an ADP RUN import file and connect to QuickBooks accounts through the API. Finance forecasts, backtests and report snapshots give the team tools for reviewing projections and retaining a view of reporting data.
How we worked
We approached the system as a data and reporting problem. Mapping tables organize imported values before they reach the reporting views. Billing rollups, facility gross profit and fee schedule rates then give finance staff related but distinct views of activity. Provider and nurse pay rules can be reviewed by facility and day, and biweekly reconciliation issues remain visible for follow-up.
We connected each outside data path to the job it supports. Clinix and Tebra supply billing information, Microsoft Graph connects Excel, QuickBooks provides account access, and ADP RUN receives an import file. Forecasts can be backtested, while report snapshots preserve a view for reference. The dashboard supports financial analysis and reconciliation; payroll execution remains outside the application.
The dashboard keeps payroll-period analysis separate from payroll execution. Finance can review facility and provider mappings, examine reconciliation items, then use the appropriate integration or export for the next step. This creates a consistent path from imported billing data to finance review without replacing established payroll tools.
Result
Finance staff can review imported billing data, facility gross profit, CMS fee schedule information and provider or nurse pay rules in one reporting dashboard. They can examine biweekly reconciliation issues, access Excel through Microsoft Graph, work with QuickBooks accounts and produce an ADP RUN import file. Forecasts, backtests and report snapshots support ongoing financial review without turning the application into a payroll processor.